Guides · Cloud Cost · aws · cloud-cost · finops
Why Is My AWS Bill So High? Anatomy of a Startup Bill
· 5 min read
Your AWS bill is high for two reasons that compound: compute you provisioned for a load that never arrived, and per-GB metered charges — NAT gateway processing, cross-AZ transfer, log ingestion — that appear nowhere on your architecture diagram. In a typical startup bill, the first category is the biggest number and the second is the biggest surprise. This post is the diagnosis; once you know where the money goes, the fix guide covers how to claw it back.
Where does the money actually go?
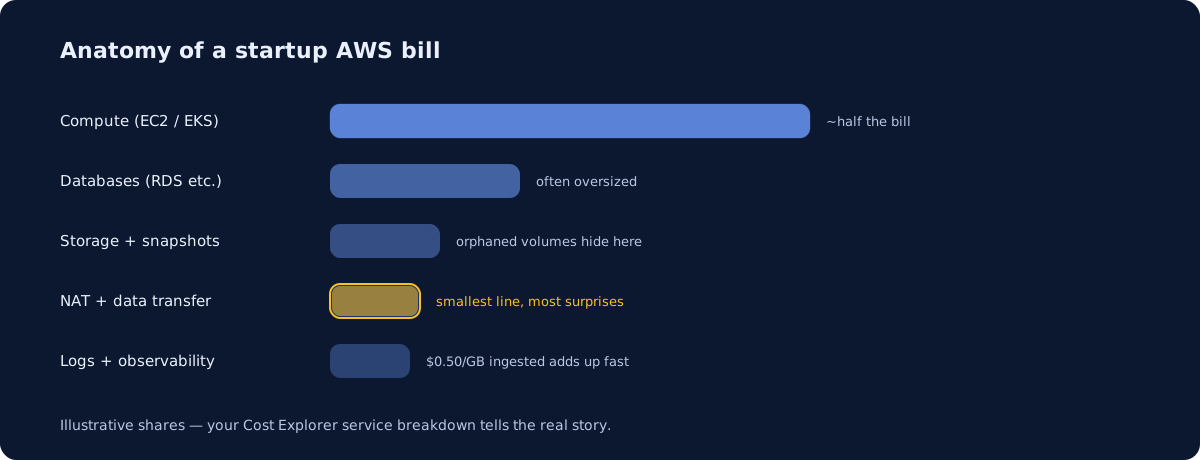
A typical funded-startup bill has five layers: compute, databases, storage, networking, and observability. Compute is usually around half the total, databases another chunk, and the rest is a long tail of small line items — which is exactly where the avoidable waste concentrates, because nobody owns the long tail.
| Layer | What’s in it | The usual leak |
|---|---|---|
| Compute | EC2, EKS nodes, Fargate, Lambda | Oversized instances, dev environments running nights and weekends |
| Databases | RDS, ElastiCache, OpenSearch | Instance sized for launch-day traffic that never came; Multi-AZ on staging |
| Storage | EBS, S3, snapshots | Unattached volumes, gp2 instead of gp3, snapshot chains nobody prunes |
| Networking | NAT gateways, cross-AZ, public IPv4 | Per-GB metering on traffic you didn’t know crossed a boundary |
| Observability | CloudWatch logs and metrics | Debug logging shipped to production at $0.50/GB |
Kubernetes shops get a special version of this: the cluster looks busy while nodes idle at low utilization. That failure mode has its own post.
Why do NAT gateway and data transfer charges surprise everyone?
Because they’re metered per gigabyte on traffic paths that are invisible in the console. A NAT gateway costs about $0.045 per hour plus $0.045 per GB processed (per AWS’s VPC pricing) — the hourly part is trivial, the per-GB part is not. Pull container images from Docker Hub through a NAT gateway on every deploy, or stream data from a third-party API into private subnets, and you’re paying that toll on every byte.
Cross-AZ traffic is the same story: around $0.01 per GB in each direction, so chatty services replicated across availability zones pay twice on every internal call. And since 2024, AWS charges $0.005 per hour for every public IPv4 address — roughly $3.60 a month each, which quietly adds up across forgotten Elastic IPs and per-node addresses.
Logs deserve their own line: CloudWatch Logs ingestion runs $0.50 per GB on the standard class, per AWS’s published pricing. A single noisy service logging debug output can out-cost the instance it runs on.
How do you read Cost Explorer properly?
Group by service first, then re-group by usage type — that second view is the one most teams never open, and it’s where “EC2-Other” splits into NAT processing, cross-AZ transfer, and EBS. Three passes, in order:
- Group by service, last 3 months, monthly. Establishes which layers matter and whether the trend is drift or a step change.
- Group by usage type, filtered to your top services. This names the actual meter:
NatGateway-Bytes,DataTransfer-Regional-Bytes,EBS:VolumeUsageand friends. - Group by tag (or linked account). If this view is mostly “no tag,” that’s a finding in itself — you can’t assign waste you can’t attribute.
Enable hourly and resource-level granularity in Cost Explorer preferences (AWS charges a small fee for it) when you need to trace a spike to a specific resource. For anything deeper, the Cost and Usage Report into Athena is the ground truth — but most startups find 80% of the answer in the usage-type view alone.
What five questions locate the waste?
These five, asked against the views above, find the bulk of what a cost audit typically flags:
- What runs at 3 a.m. on Sunday? Anything billing at full rate outside business hours that isn’t production is a scheduling problem.
- What is “EC2-Other” made of? This bucket hides NAT processing, cross-AZ transfer, and EBS — usage-type grouping breaks it open.
- What’s provisioned but idle? Unattached EBS volumes, stopped instances with paid storage, idle load balancers, unused Elastic IPs.
- What’s the compute utilization actually at? If average CPU sits in single digits, you’re paying for headroom several sizes too generous.
- What are you logging, and why? Compare log ingestion GB against what anyone has queried in the last month.
The same anatomy applies on GCP and Azure — the meter names change, the failure modes don’t. We work across all three; the AWS page covers the specifics above.
When is it worth getting help?
When the bill crosses roughly $10k/month, or when nobody on the team has opened the usage-type view — at that point an outside pass usually pays for itself in the first month of savings. Our infrastructure audit comes with a guarantee: if we don’t find savings and risks worth more than the audit fee, you don’t pay. You can see exactly what the deliverable looks like in a sample audit report, and the DevOps cost calculator will tell you what ongoing help should cost before you talk to anyone — us included.
Diagnosis first, then treatment: once your Cost Explorer answers the five questions, the cutting guide is the playbook for acting on them.
Newsletter
One practical DevOps guide a week
Real numbers, honest trade-offs, no vendor fog — same as everything here. Unsubscribe anytime.